> **🚧 PRE-ALPHA SOFTWARE:** This project is in a pre-alpha state and is intended for my own personal use only. Use at your own risk.
# I/O Riot NG (aka ior)
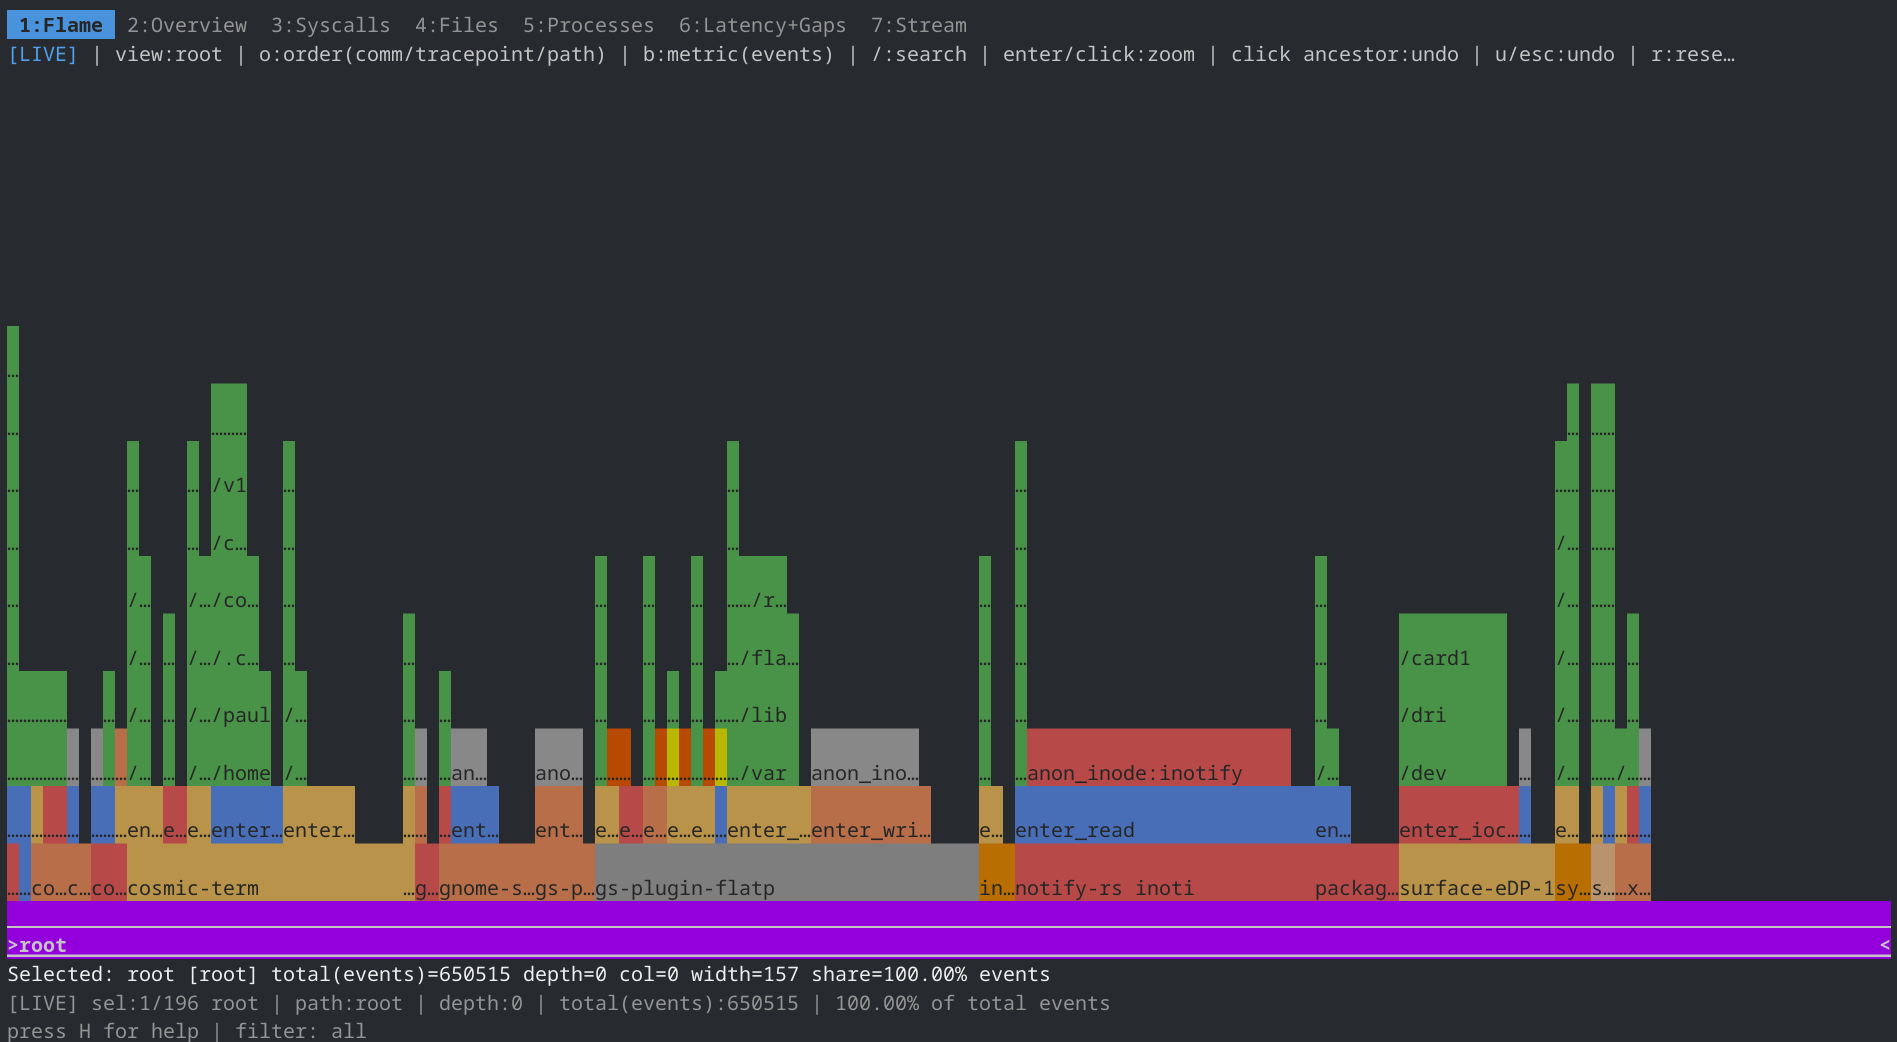
 I/O Riot NG is an experiments with BPF. This program traces for synchronous I/O syscalls and then analyses the time taken for each of those syscalls. This is especially useful for drawing FlameGraphs like these:
 Maybe this is a spiritual successor of one of my previous projects, I/O Riot https://codeberg.org/snonux/ioriot, the latter was based on SystemTap and C. The NG is based on Go, C and BPF (via libbpfgo).
This works only on Linux!
## Requirements
- Go 1.26 or newer (ior relies on cgo via libbpfgo).
## Local libbpfgo Toolchain
`ior` links against a locally built `libbpfgo` checkout. By default
`Magefile.go` expects that checkout at `../libbpfgo` relative to this repo; set
`LIBBPFGO=/absolute/path/to/libbpfgo` if you keep it elsewhere.
Pin that checkout to `v0.9.2-libbpf-1.5.1` and rebuild the static artifacts
before running `mage` targets:
```shell
git -C ../libbpfgo checkout v0.9.2-libbpf-1.5.1
git -C ../libbpfgo submodule update --init --recursive
make -C ../libbpfgo libbpfgo-static
```
Validated commands for this pin:
```shell
env GOTOOLCHAIN=auto mage world
env GOTOOLCHAIN=auto mage integrationTest
```
Troubleshooting and rollback:
- If builds fail with `bpf/bpf.h` missing, re-run the checkout, submodule sync,
and `make libbpfgo-static` commands above, then retry `env GOTOOLCHAIN=auto mage world`.
- Prefer Mage targets over raw `go test` for packages that import `libbpfgo`;
Mage injects the required `CGO_CFLAGS`, `CGO_LDFLAGS`, and `LIBBPFGO` values.
- To roll back to the previous wrapper state, repin `go.mod` to
`github.com/aquasecurity/libbpfgo v0.6.0-libbpf-1.3.0.20240111220235-90dbffffbdab`,
then reset the sibling checkout and rebuild:
```shell
git -C ../libbpfgo checkout 90dbffffbdab
git -C ../libbpfgo submodule update --init --recursive
make -C ../libbpfgo libbpfgo-static
```
## Timing Semantics
Each reported event pair has two timing counters:
- `durationNs`: syscall runtime on the same thread (`exit(current) - enter(current)`).
- `durationToPrevNs`: inter-syscall gap on the same thread (`enter(current) - exit(previous)`).
Important details:
- `durationToPrevNs` is tracked per `tid` (thread), not globally across all threads.
- The first observed syscall pair for a thread has `durationToPrevNs = 0` because there is no prior exit timestamp.
- `durationToPrevNs` is attributed to the current syscall pair (the one whose `enter` closes the gap).
- There is no separate "idle" pseudo-event bucket; use the `durationToPrev` count field when aggregated flamegraph output should emphasize inter-syscall time.
## Fedora
To get this running on Fedora 42, run:
```shell
mkdir -p ~/git
git clone https://codeberg.org/snonux/ior ~/git/ior
git clone https://github.com/aquasecurity/libbpfgo ~/git/libbpfgo
sudo dnf install -y golang clang bpftool elfutils-libelf-devel zlib-static glibc-static libzstd-static
git -C ~/git/libbpfgo checkout v0.9.2-libbpf-1.5.1
git -C ~/git/libbpfgo submodule update --init --recursive
make -C ~/git/libbpfgo libbpfgo-static
```
Need libelf static, which isn't in any repos. So we need to compile it ourselves.
```
sudo dnf install rpmdevtools dnf-utils
dnf download --source elfutils-libelf
rpm -ivh elfutils-*.src.rpm
cd ~
sudo dnf builddep rpmbuild/SPECS/*.spec
cd ~/rpmbuild/SPECS
rpmbuild -ba *.spec
mkdir ~/src
tar -C ~/src -xvjpf ~/rpmbuild/SOURCES/elfutils-*.tar.bz2
cd ~/src/elfutils-*
rm -Rf ~/rpmbuild
./configure
make
sudo cp -v ./libelf/libelf.a /usr/lib64/
```
## TUI Flamegraphs
Flamegraphs are available only inside the TUI dashboard.
Use `-fields` to change the stack order and `-count` to choose the metric.
The default stack order is `comm,path,tracepoint` (bottom to top).
## Recording Modes
`ior` has four distinct output flows. They are intentionally different:
| Mode | How to use it | What it writes | Filter behavior |
| --- | --- | --- | --- |
| TUI dashboard | default startup | nothing continuously; data stays in memory unless you export | current TUI/global filters drive what you see |
| TUI CSV snapshot export | press `e` in the dashboard | one `ior-stream-.csv` snapshot of the current filtered stream view | exports only the currently filtered in-memory rows |
| Headless `.ior.zst` export | start with `-flamegraph -name ` | one aggregated native trace artifact written at shutdown | no TUI filter stack; this is the native trace/integration workflow |
| Parquet recording | press `R` in the TUI, or start with `-parquet ` | a streaming Parquet file of traced syscall rows | TUI mode records rows that pass the active TUI filter; headless `-parquet` records all traced rows |
Important distinction:
- `.ior.zst` output is an aggregated native artifact, not a row-by-row event log.
- CSV export is a point-in-time snapshot of the ring buffer.
- Parquet recording is a streaming capture from start to stop.
- The ring buffer is capped, so CSV export is not a replacement for Parquet recording or `.ior.zst` output.
### Headless Native `.ior.zst` Output
Use `-flamegraph` when you want the native `ior` trace artifact instead of a streaming row log:
```shell
sudo ./ior -flamegraph -name trace-run -duration 60
```
Native `.ior.zst` behavior:
- writes one `*.ior.zst` file when the run ends
- stores aggregated counters for repeated syscall/path/process combinations
- is intended for `ior`'s native flamegraph and integration-style workflows
- does not preserve one output row per traced syscall
### TUI Parquet Recording
Start a recording from the dashboard with `R`.
- First `R`: open a filename prompt (`ior-recording-.parquet` by default).
- `Enter`: start recording to that file.
- Second `R`: stop and finalize the active Parquet file.
- Recording stops automatically when you quit the TUI or reselect PID/TID/session scope.
Lifecycle details:
- TUI recording uses the active TUI global filter at emission time.
- If a filter change restarts tracing, the recorder stays alive and continues writing matching rows after the restart.
- The dashboard footer shows the active recording path or the last recording error.
### Headless Parquet Recording
Use `-parquet` to skip the TUI and stream traced syscall rows directly to a Parquet file:
```shell
sudo ./ior -parquet trace.parquet -duration 60
```
Headless Parquet mode behavior:
- skips the TUI completely
- records all traced rows
- rejects content filters such as `-comm`, `-path`, `-pid`, and `-tid`
- cannot be combined with `-plain`, `-flamegraph`, `--testflames`, or `--testliveflames`
Use headless mode when you want a full recording, and TUI mode when you want interactive filtering plus optional start/stop recording from the dashboard.
### Choosing Between `.ior.zst` and Parquet
Both formats are useful, but they solve different problems:
| Question | Native `.ior.zst` | Parquet |
| --- | --- | --- |
| Data shape | aggregated counters | one row per traced syscall |
| Write pattern | collect in memory, write one compressed artifact at the end | stream rows continuously while recording |
| Best for | `ior`-native trace artifacts, flamegraph workflows, integration assertions | offline analysis in other tools, long captures, preserving per-event detail |
| Relative write cost | usually lower because repeated events are folded together before file write | usually higher because each traced row is serialized |
| Detail retained | loses original row order and per-event granularity | keeps per-event timing and syscall fields |
Rule of thumb:
- choose `.ior.zst` when you want the native `ior` artifact and do not need every traced syscall row preserved
- choose Parquet when you want a full event stream for downstream analysis outside `ior`
## TUI Navigation
The TUI interface provides an in‑screen help panel (toggle with **H**) that lists all available keys. Use this help screen to discover navigation shortcuts.
You can move between dashboard tabs:
- **tab** – next dashboard tab
- **shift+tab** – previous dashboard tab
- **1** – Overview
- **2** – Syscalls
- **3** – Files
- **4** – Processes
- **5** – Latency+Gaps
- **6** – Stream
The bottom hint shows `press H for help` when the help is hidden.
The TUI has two key scopes:
- Global hotkeys: available from dashboard screens.
- Dashboard hotkeys: behavior that depends on the active dashboard tab (especially `6:Stream`).
Help visibility:
- `H`: toggle bottom help sections on/off.
- By default, help is hidden and the bottom hint shows `press H for help`.
### Global Hotkeys
- `tab`: next dashboard tab.
- `shift+tab`: previous dashboard tab.
- `1`: `Overview` tab.
- `2`: `Syscalls` tab.
- `3`: `Files` tab.
- `4`: `Processes` tab.
- `5`: `Latency+Gaps` tab.
- `6`: `Stream` tab.
- `7`: `Stream` tab (alias).
- `e`: export filtered stream rows to CSV (`ior-stream-.csv`) in current working directory.
- `R`: start or stop Parquet recording from the TUI dashboard.
- `p`: re-open process selector (PID selection flow).
- `t`: open TID selector flow.
- `o`: open probe selection/toggling dialog.
- `r`: refresh dashboard snapshot.
- `q` or `ctrl+c`: quit.
### Dashboard / Tab-Specific Hotkeys
- `d` in `3:Files`: toggle directory-grouped files view.
- `s` in sortable table tabs (`2:Syscalls`, `3:Files`, `4:Processes`): sort by the selected column using that table's default direction.
- `S` in sortable table tabs (`2:Syscalls`, `3:Files`, `4:Processes`): reverse-sort by the selected column.
- `j/k` or `up/down` in list-like tabs (`2:Syscalls`, `3:Files`, `4:Processes`): scroll list.
`left/right` and `h/l` do not switch tabs. In `6:Stream` paused mode they move selected column.
### 6:Stream Hotkeys and Behavior
`6:Stream` has two modes:
- Live mode (`paused=false`): rows update continuously.
- Pause mode (`paused=true`): selection/cell/filter/search/export workflows are enabled.
Core controls:
- `space`: toggle live/pause.
- `g`/`G`: jump to top/tail.
- `c`: clear stream filters.
- `f`: open advanced filter modal.
- `j/k` or `up/down`: move selected row in pause mode; scroll in live mode.
- `left/right` or `h/l`: move selected column in pause mode.
#### Enter-Based Filter Stack (Pause Mode)
In pause mode, `enter` on the selected cell pushes a new filter onto a stack and immediately re-filters the current ring buffer snapshot. Filters are stackable.
- String columns use case-insensitive substring match:
- `Comm` -> `comm~`
- `Syscall` -> `syscall~`
- `File` -> `file~`
- Numeric exact match:
- `PID`, `TID`, `FD`, `Ret`, `Bytes`
- Numeric threshold (`>=`):
- `Latency` -> `latency>=selected_value`
- `Gap` -> `gap>=selected_value`
Undo:
- `esc` in pause mode pops the most recent filter from the stack (LIFO).
- Repeated `esc` keeps undoing until no stacked filters remain.
#### Regex Search (Pause Mode)
- `/`: open regex prompt and search forward.
- `?`: open regex prompt and search backward.
- Search checks all stream columns/fields and wraps around ring-buffer rows.
- `n`: next match in the same direction as last `/` or `?`.
- `N`: previous match (opposite direction).
#### Stream CSV Export (Pause Mode)
- `x`: quick export filtered stream rows to CSV (`ior-stream-.csv`).
- `X`: export filtered stream rows to CSV with filename prompt.
- `E`: open last stream-exported CSV in foreground editor (`EDITOR` -> `VISUAL` -> `SUDO_EDITOR` -> fallback `hx`, else `vi`).
Export behavior:
- `e` exports a fresh filtered stream snapshot using the current shared TUI filter, even outside paused mode.
- `x`/`X` export the currently paused stream rows, preserving the stream tab's exact paused view.
Maybe this is a spiritual successor of one of my previous projects, I/O Riot https://codeberg.org/snonux/ioriot, the latter was based on SystemTap and C. The NG is based on Go, C and BPF (via libbpfgo).
This works only on Linux!
## Requirements
- Go 1.26 or newer (ior relies on cgo via libbpfgo).
## Local libbpfgo Toolchain
`ior` links against a locally built `libbpfgo` checkout. By default
`Magefile.go` expects that checkout at `../libbpfgo` relative to this repo; set
`LIBBPFGO=/absolute/path/to/libbpfgo` if you keep it elsewhere.
Pin that checkout to `v0.9.2-libbpf-1.5.1` and rebuild the static artifacts
before running `mage` targets:
```shell
git -C ../libbpfgo checkout v0.9.2-libbpf-1.5.1
git -C ../libbpfgo submodule update --init --recursive
make -C ../libbpfgo libbpfgo-static
```
Validated commands for this pin:
```shell
env GOTOOLCHAIN=auto mage world
env GOTOOLCHAIN=auto mage integrationTest
```
Troubleshooting and rollback:
- If builds fail with `bpf/bpf.h` missing, re-run the checkout, submodule sync,
and `make libbpfgo-static` commands above, then retry `env GOTOOLCHAIN=auto mage world`.
- Prefer Mage targets over raw `go test` for packages that import `libbpfgo`;
Mage injects the required `CGO_CFLAGS`, `CGO_LDFLAGS`, and `LIBBPFGO` values.
- To roll back to the previous wrapper state, repin `go.mod` to
`github.com/aquasecurity/libbpfgo v0.6.0-libbpf-1.3.0.20240111220235-90dbffffbdab`,
then reset the sibling checkout and rebuild:
```shell
git -C ../libbpfgo checkout 90dbffffbdab
git -C ../libbpfgo submodule update --init --recursive
make -C ../libbpfgo libbpfgo-static
```
## Timing Semantics
Each reported event pair has two timing counters:
- `durationNs`: syscall runtime on the same thread (`exit(current) - enter(current)`).
- `durationToPrevNs`: inter-syscall gap on the same thread (`enter(current) - exit(previous)`).
Important details:
- `durationToPrevNs` is tracked per `tid` (thread), not globally across all threads.
- The first observed syscall pair for a thread has `durationToPrevNs = 0` because there is no prior exit timestamp.
- `durationToPrevNs` is attributed to the current syscall pair (the one whose `enter` closes the gap).
- There is no separate "idle" pseudo-event bucket; use the `durationToPrev` count field when aggregated flamegraph output should emphasize inter-syscall time.
## Fedora
To get this running on Fedora 42, run:
```shell
mkdir -p ~/git
git clone https://codeberg.org/snonux/ior ~/git/ior
git clone https://github.com/aquasecurity/libbpfgo ~/git/libbpfgo
sudo dnf install -y golang clang bpftool elfutils-libelf-devel zlib-static glibc-static libzstd-static
git -C ~/git/libbpfgo checkout v0.9.2-libbpf-1.5.1
git -C ~/git/libbpfgo submodule update --init --recursive
make -C ~/git/libbpfgo libbpfgo-static
```
Need libelf static, which isn't in any repos. So we need to compile it ourselves.
```
sudo dnf install rpmdevtools dnf-utils
dnf download --source elfutils-libelf
rpm -ivh elfutils-*.src.rpm
cd ~
sudo dnf builddep rpmbuild/SPECS/*.spec
cd ~/rpmbuild/SPECS
rpmbuild -ba *.spec
mkdir ~/src
tar -C ~/src -xvjpf ~/rpmbuild/SOURCES/elfutils-*.tar.bz2
cd ~/src/elfutils-*
rm -Rf ~/rpmbuild
./configure
make
sudo cp -v ./libelf/libelf.a /usr/lib64/
```
## TUI Flamegraphs
Flamegraphs are available only inside the TUI dashboard.
Use `-fields` to change the stack order and `-count` to choose the metric.
The default stack order is `comm,path,tracepoint` (bottom to top).
## Recording Modes
`ior` has four distinct output flows. They are intentionally different:
| Mode | How to use it | What it writes | Filter behavior |
| --- | --- | --- | --- |
| TUI dashboard | default startup | nothing continuously; data stays in memory unless you export | current TUI/global filters drive what you see |
| TUI CSV snapshot export | press `e` in the dashboard | one `ior-stream-.csv` snapshot of the current filtered stream view | exports only the currently filtered in-memory rows |
| Headless `.ior.zst` export | start with `-flamegraph -name ` | one aggregated native trace artifact written at shutdown | no TUI filter stack; this is the native trace/integration workflow |
| Parquet recording | press `R` in the TUI, or start with `-parquet ` | a streaming Parquet file of traced syscall rows | TUI mode records rows that pass the active TUI filter; headless `-parquet` records all traced rows |
Important distinction:
- `.ior.zst` output is an aggregated native artifact, not a row-by-row event log.
- CSV export is a point-in-time snapshot of the ring buffer.
- Parquet recording is a streaming capture from start to stop.
- The ring buffer is capped, so CSV export is not a replacement for Parquet recording or `.ior.zst` output.
### Headless Native `.ior.zst` Output
Use `-flamegraph` when you want the native `ior` trace artifact instead of a streaming row log:
```shell
sudo ./ior -flamegraph -name trace-run -duration 60
```
Native `.ior.zst` behavior:
- writes one `*.ior.zst` file when the run ends
- stores aggregated counters for repeated syscall/path/process combinations
- is intended for `ior`'s native flamegraph and integration-style workflows
- does not preserve one output row per traced syscall
### TUI Parquet Recording
Start a recording from the dashboard with `R`.
- First `R`: open a filename prompt (`ior-recording-.parquet` by default).
- `Enter`: start recording to that file.
- Second `R`: stop and finalize the active Parquet file.
- Recording stops automatically when you quit the TUI or reselect PID/TID/session scope.
Lifecycle details:
- TUI recording uses the active TUI global filter at emission time.
- If a filter change restarts tracing, the recorder stays alive and continues writing matching rows after the restart.
- The dashboard footer shows the active recording path or the last recording error.
### Headless Parquet Recording
Use `-parquet` to skip the TUI and stream traced syscall rows directly to a Parquet file:
```shell
sudo ./ior -parquet trace.parquet -duration 60
```
Headless Parquet mode behavior:
- skips the TUI completely
- records all traced rows
- rejects content filters such as `-comm`, `-path`, `-pid`, and `-tid`
- cannot be combined with `-plain`, `-flamegraph`, `--testflames`, or `--testliveflames`
Use headless mode when you want a full recording, and TUI mode when you want interactive filtering plus optional start/stop recording from the dashboard.
### Choosing Between `.ior.zst` and Parquet
Both formats are useful, but they solve different problems:
| Question | Native `.ior.zst` | Parquet |
| --- | --- | --- |
| Data shape | aggregated counters | one row per traced syscall |
| Write pattern | collect in memory, write one compressed artifact at the end | stream rows continuously while recording |
| Best for | `ior`-native trace artifacts, flamegraph workflows, integration assertions | offline analysis in other tools, long captures, preserving per-event detail |
| Relative write cost | usually lower because repeated events are folded together before file write | usually higher because each traced row is serialized |
| Detail retained | loses original row order and per-event granularity | keeps per-event timing and syscall fields |
Rule of thumb:
- choose `.ior.zst` when you want the native `ior` artifact and do not need every traced syscall row preserved
- choose Parquet when you want a full event stream for downstream analysis outside `ior`
## TUI Navigation
The TUI interface provides an in‑screen help panel (toggle with **H**) that lists all available keys. Use this help screen to discover navigation shortcuts.
You can move between dashboard tabs:
- **tab** – next dashboard tab
- **shift+tab** – previous dashboard tab
- **1** – Overview
- **2** – Syscalls
- **3** – Files
- **4** – Processes
- **5** – Latency+Gaps
- **6** – Stream
The bottom hint shows `press H for help` when the help is hidden.
The TUI has two key scopes:
- Global hotkeys: available from dashboard screens.
- Dashboard hotkeys: behavior that depends on the active dashboard tab (especially `6:Stream`).
Help visibility:
- `H`: toggle bottom help sections on/off.
- By default, help is hidden and the bottom hint shows `press H for help`.
### Global Hotkeys
- `tab`: next dashboard tab.
- `shift+tab`: previous dashboard tab.
- `1`: `Overview` tab.
- `2`: `Syscalls` tab.
- `3`: `Files` tab.
- `4`: `Processes` tab.
- `5`: `Latency+Gaps` tab.
- `6`: `Stream` tab.
- `7`: `Stream` tab (alias).
- `e`: export filtered stream rows to CSV (`ior-stream-.csv`) in current working directory.
- `R`: start or stop Parquet recording from the TUI dashboard.
- `p`: re-open process selector (PID selection flow).
- `t`: open TID selector flow.
- `o`: open probe selection/toggling dialog.
- `r`: refresh dashboard snapshot.
- `q` or `ctrl+c`: quit.
### Dashboard / Tab-Specific Hotkeys
- `d` in `3:Files`: toggle directory-grouped files view.
- `s` in sortable table tabs (`2:Syscalls`, `3:Files`, `4:Processes`): sort by the selected column using that table's default direction.
- `S` in sortable table tabs (`2:Syscalls`, `3:Files`, `4:Processes`): reverse-sort by the selected column.
- `j/k` or `up/down` in list-like tabs (`2:Syscalls`, `3:Files`, `4:Processes`): scroll list.
`left/right` and `h/l` do not switch tabs. In `6:Stream` paused mode they move selected column.
### 6:Stream Hotkeys and Behavior
`6:Stream` has two modes:
- Live mode (`paused=false`): rows update continuously.
- Pause mode (`paused=true`): selection/cell/filter/search/export workflows are enabled.
Core controls:
- `space`: toggle live/pause.
- `g`/`G`: jump to top/tail.
- `c`: clear stream filters.
- `f`: open advanced filter modal.
- `j/k` or `up/down`: move selected row in pause mode; scroll in live mode.
- `left/right` or `h/l`: move selected column in pause mode.
#### Enter-Based Filter Stack (Pause Mode)
In pause mode, `enter` on the selected cell pushes a new filter onto a stack and immediately re-filters the current ring buffer snapshot. Filters are stackable.
- String columns use case-insensitive substring match:
- `Comm` -> `comm~`
- `Syscall` -> `syscall~`
- `File` -> `file~`
- Numeric exact match:
- `PID`, `TID`, `FD`, `Ret`, `Bytes`
- Numeric threshold (`>=`):
- `Latency` -> `latency>=selected_value`
- `Gap` -> `gap>=selected_value`
Undo:
- `esc` in pause mode pops the most recent filter from the stack (LIFO).
- Repeated `esc` keeps undoing until no stacked filters remain.
#### Regex Search (Pause Mode)
- `/`: open regex prompt and search forward.
- `?`: open regex prompt and search backward.
- Search checks all stream columns/fields and wraps around ring-buffer rows.
- `n`: next match in the same direction as last `/` or `?`.
- `N`: previous match (opposite direction).
#### Stream CSV Export (Pause Mode)
- `x`: quick export filtered stream rows to CSV (`ior-stream-.csv`).
- `X`: export filtered stream rows to CSV with filename prompt.
- `E`: open last stream-exported CSV in foreground editor (`EDITOR` -> `VISUAL` -> `SUDO_EDITOR` -> fallback `hx`, else `vi`).
Export behavior:
- `e` exports a fresh filtered stream snapshot using the current shared TUI filter, even outside paused mode.
- `x`/`X` export the currently paused stream rows, preserving the stream tab's exact paused view.